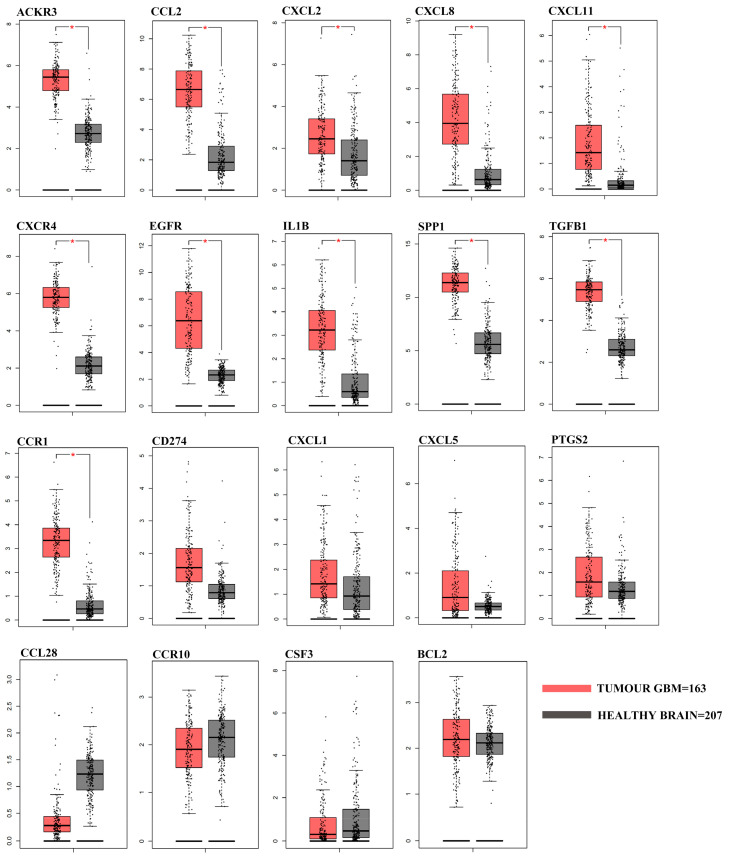
Figure 5.
Differential gene expression analysis in the TCGA-GBM RNA-seq dataset. Box plots represent the gene expression levels in the TCGA-GBM dataset (n = 163) and in the TCGA-GTEx matched normal samples (n = 207) of the 19 differentially expressed genes identified with the RT2 Profiler array. Data was obtained and plotted from the GEPIA web server (|Log2FC| Cutoff: 1; * p value < 0.01).

