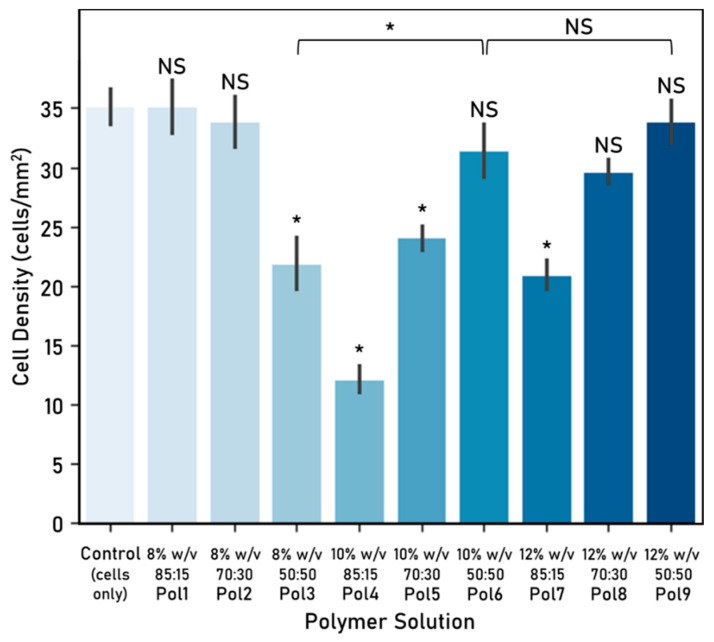
Figure 7.
Cell-fibre interaction: cell density (cells/mm2) after 72 h culture (mean ± standard deviation). Cell seeding number: 30,000 cells, 48-well plate used, control: cells-only wells. Electrospinning parameters—time: 60 s, solvent: TEF, voltage range: 9.82–10.56 kV, distance between nozzle and collector: 15 cm. Significant (*) and nonsignificant (NS) differences between samples are shown. Unless otherwise specified, comparisons are made between the samples and the cells-only control. (ANOVA/Tukey, p < 0.05; n = 3).

