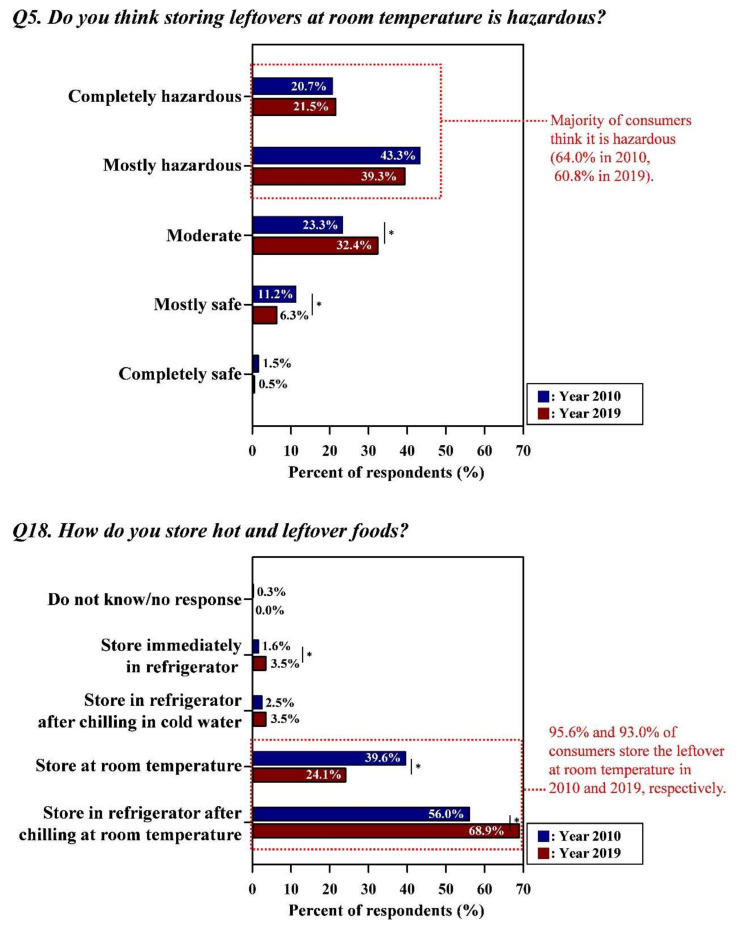
Figure 3.
The gap between the consumers’ perceptions and behaviors regarding the leftovers. Asterisk (*) indicated between graphs means the significant differences of responses (the Kruskal–Wallis test; p < 0.05) in each answer option from Year 2010 and Year 2019. Red letters indicated the improper risk perceptions (i.e., the response in opposition to conventional food safety guidelines) and high-risk behaviors of consumers. All data regarding the percentage of the combined answer options (e.g., Always + Frequently) are provided in Table S1.

