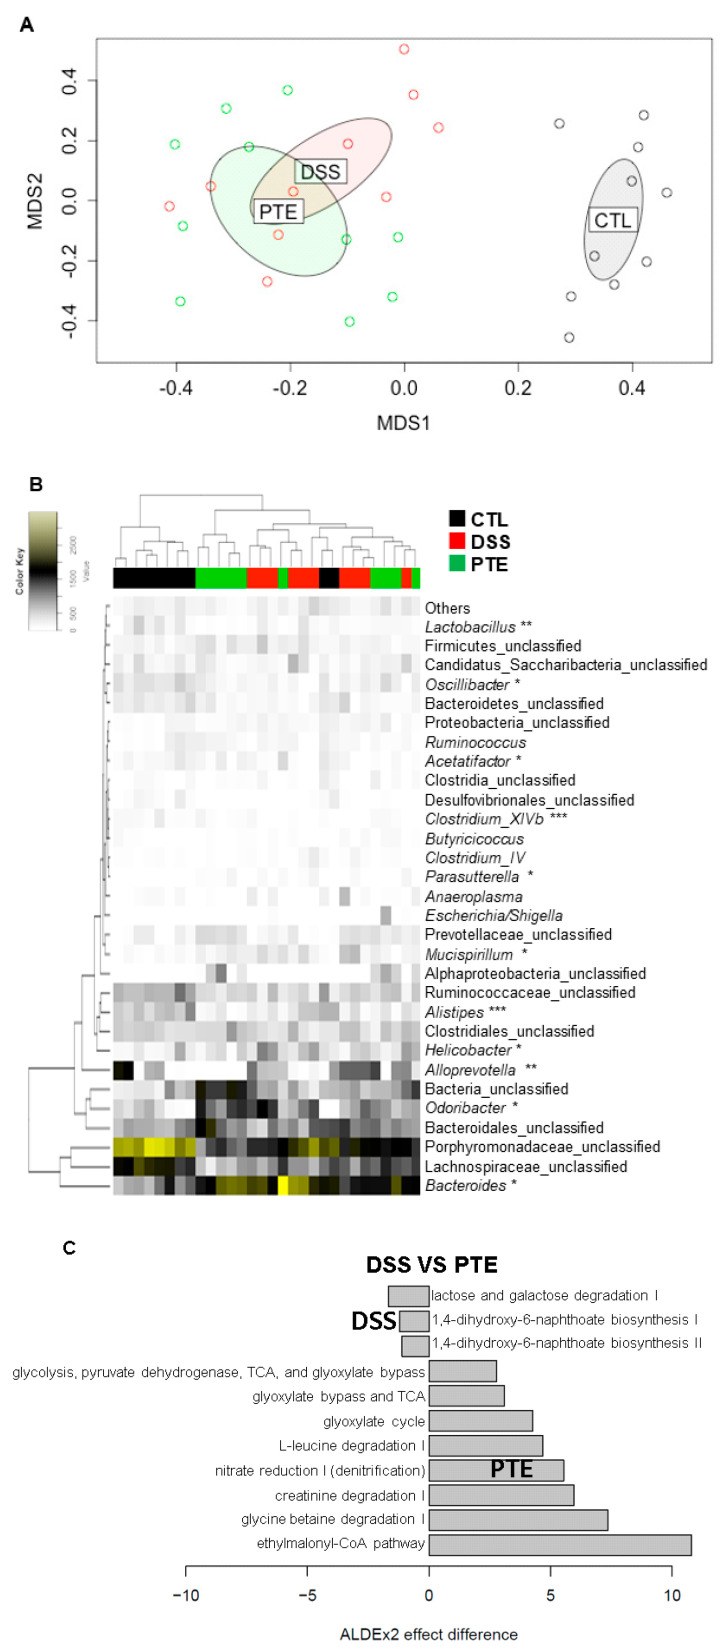
Figure 4.
The comparison analysis of microbial community (n = 10) using non-metric multidimensional scaling (NMDS) plotting and heatmap. (A) NMDS analysis. The ellipses were drawn with 0.95 confidence level in NMDS plotting. (B) Genus level taxonomic composition of relative abundance in the mice gut microbiota. *, **, and *** indicate significant difference between CTL and DSS, DSS and PTE, and both, respectively. (C) Differentially abundant predicted metabolic pathways in DSS and PTE groups. CTL, DSS, and PTE indicate normal group, DSS-treated group and DSS plus PT extracts-treated group, respectively.

