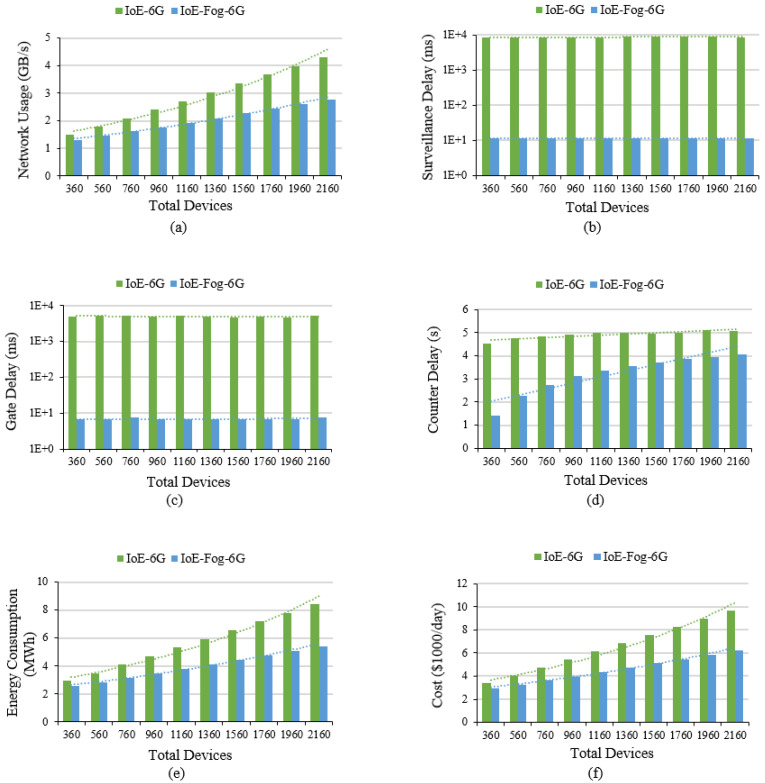
Figure 5.
Smart airport case study results: (a) Total network usage, (b) Smart surveillance application average loop end-to-end delay on a log scale, (c) Smart gate application average loop end-to-end Delay on a log scale, (d) Smart counter application average loop end-to-end delay, (e) Network energy consumption, and (f) Estimated energy cost.

