Table 4.
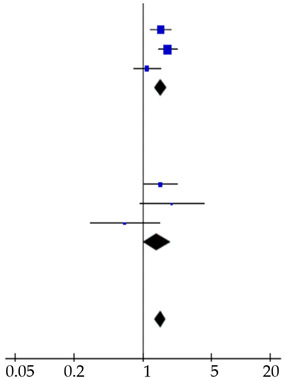
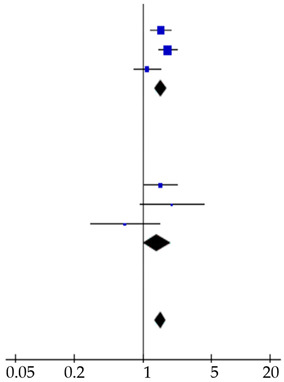
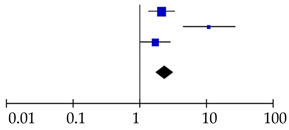
Forest plots of prognostic value of (A) CA19-9 and (B) CEA on overall survival in PDAC patients, including subgroup analysis. The prognostic value of CA19-9 on recurrence in resected PDAC patients was also shown (C).
| Reference | Patients (n) | Hazard Ratio (95% CI) | Hazard Ratio |
|---|---|---|---|
| A Prognostic Value CA19–9 on Survival | |||
| Advanced disease cohort |

|
||
| Reitz et al., 2015 [26] | 288 | 1.50 (1.17–1.91) | |
| Imaoka et al., 2016 [20] | 433 | 1.09 (0.81–1.47) | |
| Song et al., 2018 [28] | 59 | 2.22 (1.24–3.98) | |
| Tingle et al., 2018 [29] | 115 | 2.70 (1.10–6.63) | |
| This study | 224 | 0.89 (0.64–1.24) | |
| Subtotal | 1119 | 1.28 (1.10–1.50) | |
| Heterogeneity: χ2 = 13.43, d.f. = 4, p = 0.009; I2 = 70%. Test for overall effect: Z = 3.13, p = 0.002 | |||
| Resected cohort | |||
| Smith et al., 2008 [27] | 109 | 1.17 (1.02–1.35) | |
| Lee et al., 2013 [23] | 187 | 0.88 (0.57–1.35) | |
| Dong et al., 2014 [17] | 139 | 1.96 (1.24–3.10) | |
| Reitz et al., 2015 [26] | 105 | 2.50 (1.51–4.15) | |
| Asaoka et al., 2016 [7] | 46 | 3.71 (1.23–11.16) | |
| Kondo et al., 2017 [22] | 198 | 0.84 (0.34–2.09) | |
| This study | 151 | 2.59 (1.52–4.41) | |
| Subtotal | 935 | 1.30 (1.15–1.46) | |
| Heterogeneity: χ2 = 25.62, d.f. = 6, p < 0.001; I2 = 77%. Test for overall effect: Z = 4.27, p < 0.001 | |||
| Total | 2054 | 1.29 (1.17–1.42) | |
| Heterogeneity: χ2 = 39.06, d.f. = 11, p < 0.001; I2 = 72% Test for overall effect: Z = 5.30, p < 0.001 Test for subgroup differences: χ2 = 0.01, d.f. = 1, p = 0.91; I2 = 0% |
|||
| B Prognostic value CEA on survival | |||
| Advanced disease cohort |

|
||
| Reitz et al., 2015 [26] | 288 | 1.54 (1.20–1.97) | |
| Imaoka et al., 2016 [20] | 433 | 1.81 (1.45–2.26) | |
| This study | 224 | 1.11 (0.81–1.52) | |
| Subtotal | 945 | 1.54 (1.33–1.78) | |
| Heterogeneity: χ2 = 6.13, d.f. = 2, p = 0.05; I2 = 67%. Test for overall effect: Z = 5.78, p < 0.001 | |||
| Resected cohort | |||
| Lee et al., 2013 [23] | 187 | 1.52 (1.03–2.24) | |
| Reitz et al., 2015 [26] | 105 | 1.99 (0.94–4.22) | |
| This study | 151 | 0.66 (0.29–1.48) | |
| Subtotal | 443 | 1.40 (1.02–1.92) | |
| Heterogeneity: χ2 = 25.62, d.f. = 6, p < 0.001; I2 = 77%. Test for overall effect: Z = 4.27, p < 0.001 | |||
| Total | 1388 | 1.51 (1.33–1.73) | |
| Heterogeneity: χ2 = 10.74, d.f. = 5, p = 0.06; I2 = 53%. Test for overall effect: Z = 6.13, p < 0.001 Test for subgroup differences: χ2 = 0.27, d.f. = 1, p = 0.60; I2 = 0% |
|||
| C Prognostic value CA19–9 on recurrence | |||
| Waraya et al., 2009 [9] | 117 | 2.16 (1.39–3.36) |

|
| Sugiura et al., 2012 [8] | 154 | 11.19 (4.55–27.5) | |
| This study | 151 | 1.74 (1.06–2.86) | |
| Total | 422 | 2.41 (1.77–3.29) | |
| Heterogeneity: χ2 = 13.09, d.f. = 2, p = 0.001; I2 = 85%. Test for overall effect: Z = 5.58, p < 0.001 | |||
Abbreviations: CA19-9: carbohydrate antigen 19-9; CEA: carcinoembryonic antigen; d.f.: degrees of freedom.
