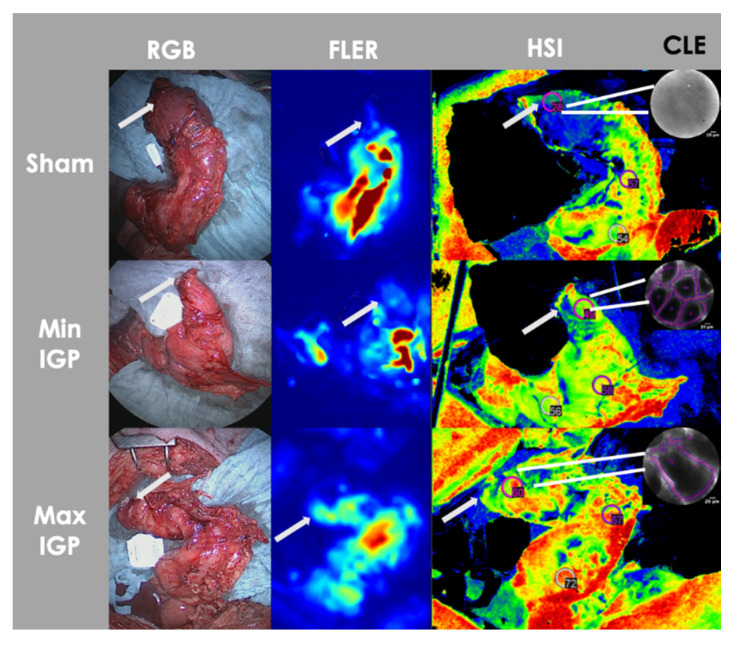
Figure 8.
Serosal and mucosal optical imaging quantification. Visual representation of serosal (FLER, HSI) and mucosal (CLE) optical imaging quantification modalities of a gastric conduit of each group. The perfusion is visually incremented at the gastric conduit fundus/future anastomotic region (white arrow) in the IGP groups when compared to the sham group in all imaging modalities.

