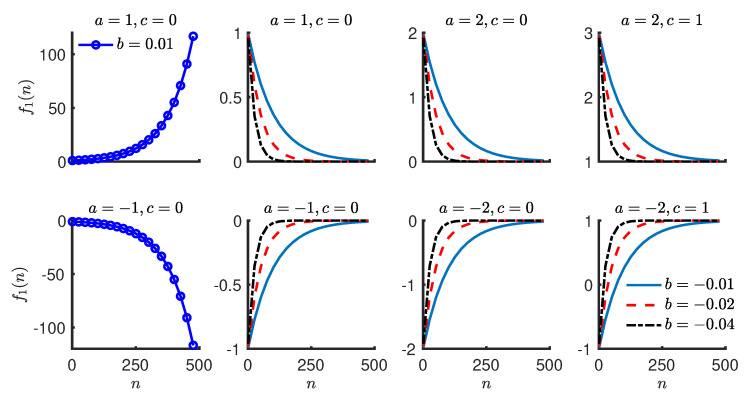
Figure 2.
Single exponential function with different parameter values. The first two plots in the first column show growing exponential functions. The remaining plots show decaying exponential functions. c determines the final value of the function. a determines the change in the exponential function from the beginning to the end. b determines the relative rate of change.

