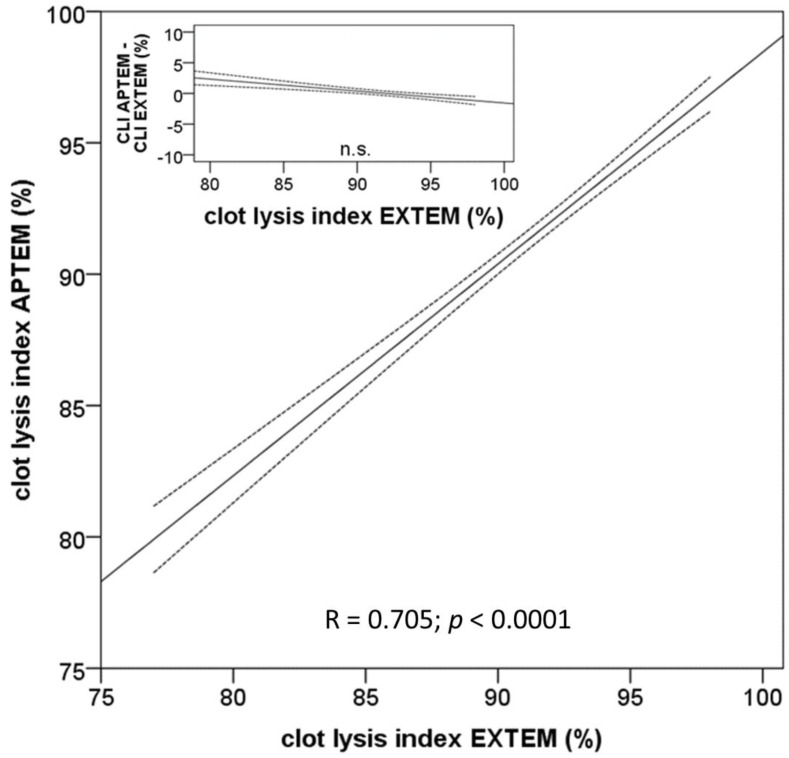
Figure 5.
Comparison of lysis index obtained with the ROTEM™ EXTEM- and APTEM-assays before the begin of the surgical procedure. The regression curve and the confidence interval of the mean (95%) demonstrate a high correlation of both variables and thus exclude fibrinolysis in the samples. The Bland–Altman plot in the inset demonstrates that there is no significant difference between the clot lysis index obtained with the APTEM- and the EXTEM-assays.

