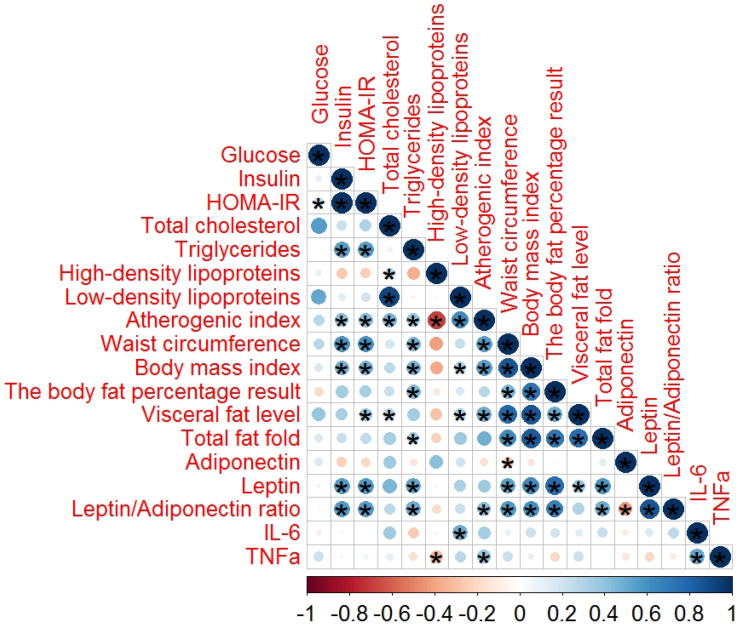
Figure 2.
Spearman’s correlation analysis of the adipocytokines in patients with schizophrenia without MetS. In this figure, the red and black circles refer to negative and positive correlations, respectively; * p < 0.05. The size and color intensity of the circles are proportional to the correlation coefficient. In the legend at the bottom, the intensity of the color shows the rate of correlations and the corresponding relationships.

