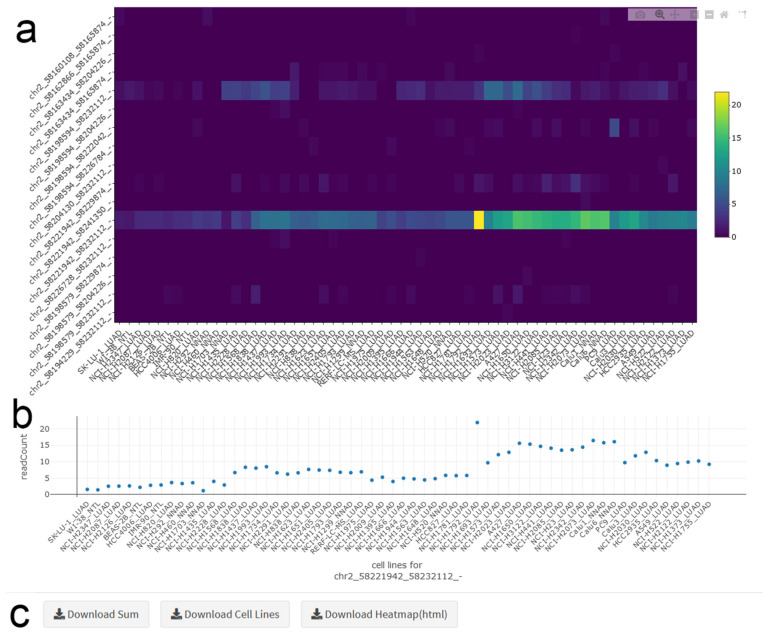
Figure 3.
circRNA Heatmap. (a) The heatmap shows the abundance of all circRNAs of a selected gene in all cell lines. Hovering over the map provides details for datapoints. LUAD: Lung Adenocarcinoma, NNAD: NSCLC (non-small cell lung cancer) Non-Adenocarcinoma, NTL: Non-Transformed Lung. (b) The scatter plot depicts read counts for one specific circRNA in all cell lines. (c) Panels for downloading data and figures.

