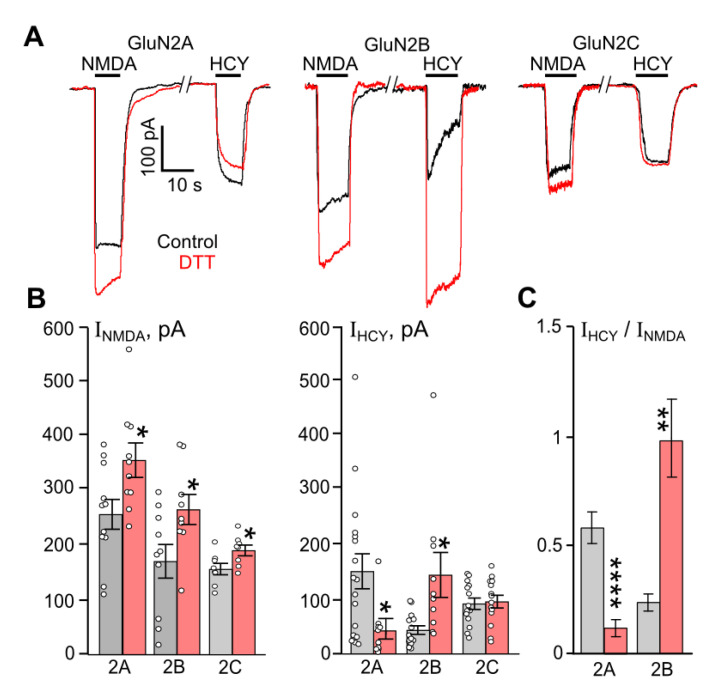
Figure 1.
Comparison of DTT effects on currents activated by NMDA and HCY in HEK293 cells expressing recombinant NMDARs. (A) Representative current traces recorded at Vh = −70 mV in cells expressing either GluN1/2A, GluN1/2B, or GluN1/2C receptors activated by 100 µM NMDA and 100 µM HCY in control (black) and after treatment with 1 mM DTT for 90 s (red). Applications of agonists are shown above the traces by lines. (B) Quantitative comparison of steady-state amplitudes of currents elicited by NMDA (INMDA). * Data are significantly different for GluN1/2A (n = 11, p = 0.02, Student’s t-test), GluN1/2B (n = 10, p = 0.03, Student’s t-test), and GluN1/2C (n = 7, p = 0.03, Student’s t-test) receptors. Quantitative comparison of steady-state amplitudes of currents elicited by HCY (IHCY). * Data differ significantly for GluN1/2A (n = 14, p = 0.01, Student’s t-test) and GluN1/2B (n = 17, p = 0.02, Student’s t-test) receptors. Mean values ± SEM are plotted. (C) Average ratios of the amplitudes of currents (IHCY/INMDA) obtained for each cell. **** Data for GluN1/2A receptors differ significantly (n = 11, p = 0.00008, Student’s t-test). ** Data for GluN1/2B receptors differ significantly (n = 14, p = 0.0017, Student’s t-test). For all plots, black columns—the data obtained in control, red columns—the data obtained after treatment with 1 mM DTT. Mean values ± SEM are shown.

