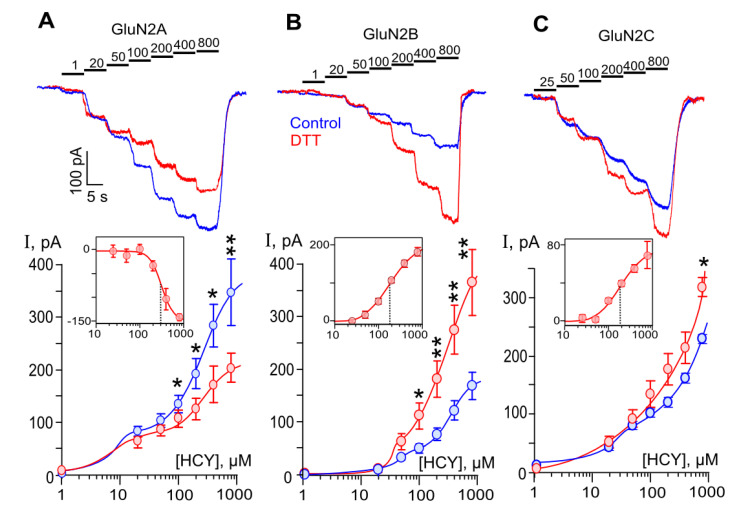
Figure 2.
DTT effects on currents activated by HCY through recombinant NMDARs. Concentration dependence of HCY-elicited currents in HEK293 cells expressing GluN1/2A, GluN1/2B, or GluN1/2C NMDA receptors, (A–C), correspondently. (Top panels) Currents elicited by HCY concentrations (indicated above the records in µM) in control (blue) and after 90 s treatment with 1 mM DTT (red) recorded at Vh = −70 mV. (Bottom panels) Concentration-response curves obtained in control (blue) and DTT-treated cells (red) expressing GluN1/2A (n = 8), GluN1/2B (n = 9), and GluN1/2C (n = 15) NMDARs. Data are significantly different from control by Student’s t-test in GluN1/2A (p = 0.03 *, 0.01 *, 0.01 *, 0.004 ** for [HCY]s of 100, 200, 400, 800 µM), GluN1/2B (p = 0.01 *, 0.007 **, 0.002 **, 0.001 ** for [HCY]s of 100, 200, 400, 800 µM), and GluN1/2C (p = 0.02 * for [HCY] of 800 µM) NMDARs. Mean values ± SEM are shown. The curves are fitted using biphasic Hill equation. The inserts show the difference between currents obtained at the same [HCY]s by subtracting currents recorded in control from currents recorded after DTT treatment. The curves are fitted using monophasic Hill equation with the following parameters: IC50 = 308 ± 31 µM, h = 3.3 ± 0.8 (n = 5); EC50 = 180 ± 7 µM, h = 1.4 ± 0.2 (n = 6); EC50 = 185 ± 49 µM, h = 1.6 ± 0.6 (n = 6), for GluN1/2A, GluN1/2B, and GluN1/2C NMDARs, correspondently. Mean values ± SEM are shown.

