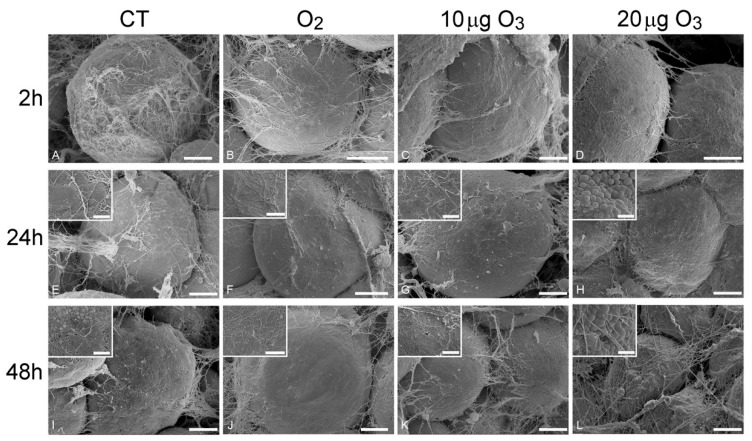
Figure 2.
Scanning electron micrographs of adipocytes 2 h (A–D), 24 h (E–H) and 48 h (I–L) after gas treatment. At 2 h, the adipocytes were spherical with smooth surface and surrounded by an extracellular network of thin collagen fibres in control (A), O2- (B), 10 µg O3- (C) and 20 µg O3- (D) treated samples. At 24 h, control (E), O2- (F) and 10 µg O3- (G) treated samples maintained a well-preserved morphology, while adipocytes exposed to 20 µg O3 (H) showed small lipid droplets budding from the surface. At 48 h, control adipocytes (I) showed clusters of lipid droplets budding from the surface; O2 (J) and 10 µg O3 (K)-treated samples showed well-preserved spherical adipocytes with smooth surface. 20 µg O3-treated samples (L) showed slight depressions and many budding lipid droplets. CT, control. Bars, 10 µm (A–L), 2 µm (insets).

