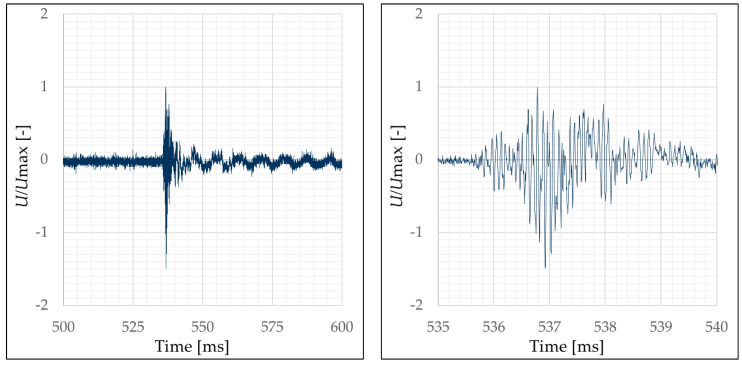
Figure 11.
Signal measured with acceleration sensor ACC1, uncalibrated but normalized with the maximum value (detailed visualization of the maximum and minimum peak values in the right diagram), complete signal (left) visualization of the first peak (right); graphic: Hering [17].

