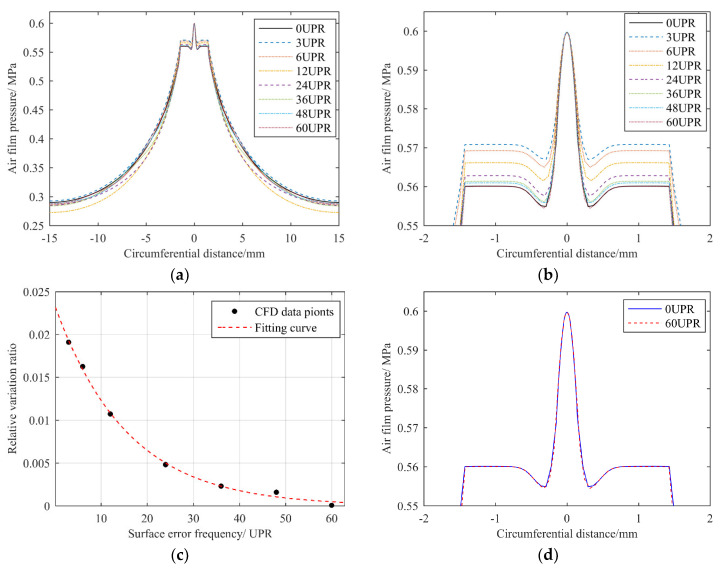
Figure 8.
Comparison of CFD results of contour error in different frequencies: (a) pressure distribution curve on the rotor’s surface along the circumferential direction; (b) local amplified pressure distribution at the position of orifice chamber; (c) relative variation ratio of the film pressure under different contour error frequencies; (d) comparison of pressure distribution at the orifice chamber with a contour error frequency of 0 UPR and 60 UPR.

