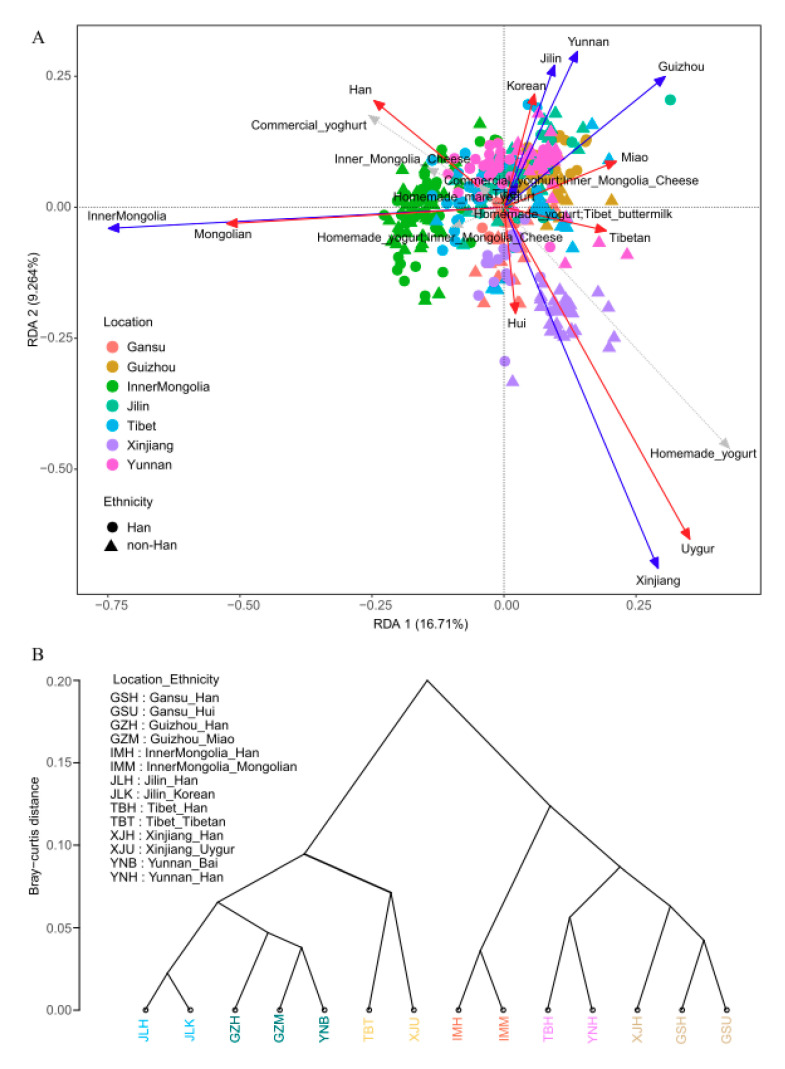
Figure 1.
(A) Redundancy analysis (RDA) biplot (RDA on a covariance matrix, scaling 2) showing the two first axes of a canonical ordination of 394 samples. Circles and triangles represent different ethnicity [Han and other minorities (non_Han)] with 7 colors used to identify geographic location; only three factors (geographic location by using blue arrows, ethnicity by using red arrows and types_of_fermented_dairy_products by using grey arrows) were retained from 122 potential influencing variables after the forward selection. (B) Complete linkage agglomerative clustering dendrogram of Bray–Curtis distance of genera among different groups. The X-axis labels in different colors represent different groups.

