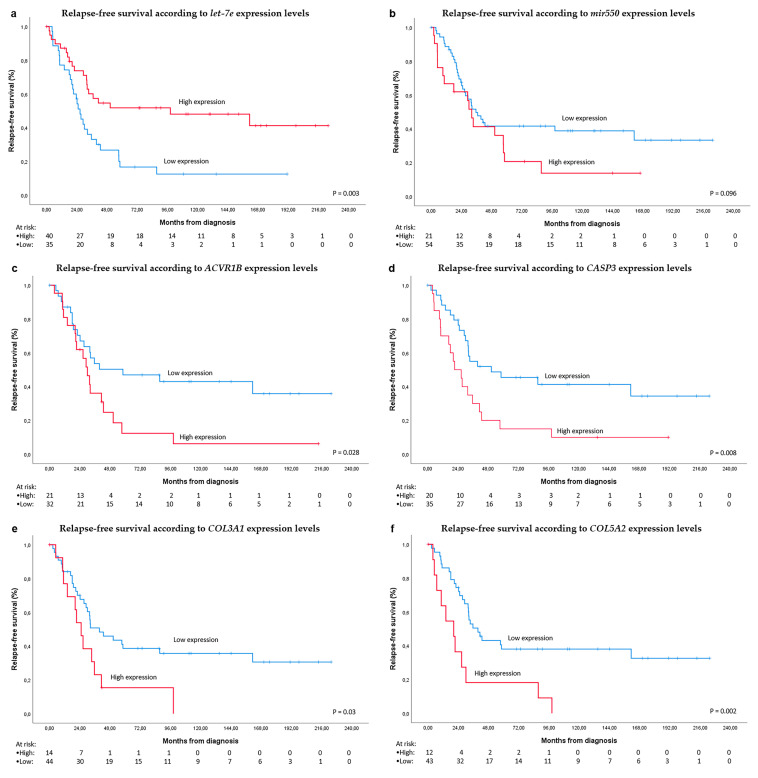
Figure 3.
Survival analyses. (a) relapse-free survival (RFS) according to let-7e expression levels in the small intestine validation set; (b). RFS according to MIR550 expression levels; (c) RFS according to ACVR1B expression levels; (d) RFS according to CASP3 expression levels; (e) RFS according to COL3A1 expression levels; (f) RFS according to COL5A2 expression levels. Cutoff points were calculated with the ROC curve, separating into High and Low expression groups, when the expression levels were above or below the cutoff, respectively.

