Figure 4.
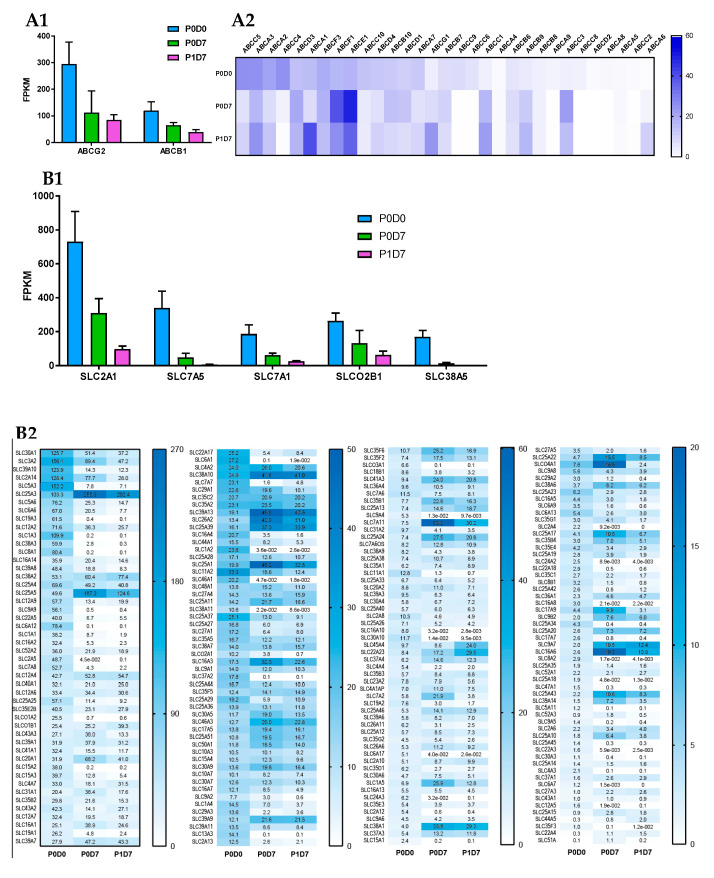
Changes in mRNA levels of ABC and SLC transporters across P0D0, P0D7 and BEC fractions. (A) Comparison of the expression levels (FPKM) between the different ABC transporters present in the brain microvascular P0D0, P0D7 and P1D7 fractions. (A1) ABCB1 and ABCG2 are by far the most expressed ABC transporters across the 3 cell population fractions. Results represent average FPKM and are expressed and mean ± SD (n = 6–8). (B) Comparison of the expression levels (FPKM) between the different SLC transporters present in the brain microvascular P0D0, P0D7 and P1D7 fractions. (B1) SLC2A1, SLC7A5, SLC7A1, SLCO2B1, SLC3A2 and SLC38A5 are the most expressed SLC transporters at P0D0 but are downregulated in vitro. Results represent average FPKM and are expressed and mean ± SD (n = 6–8).

