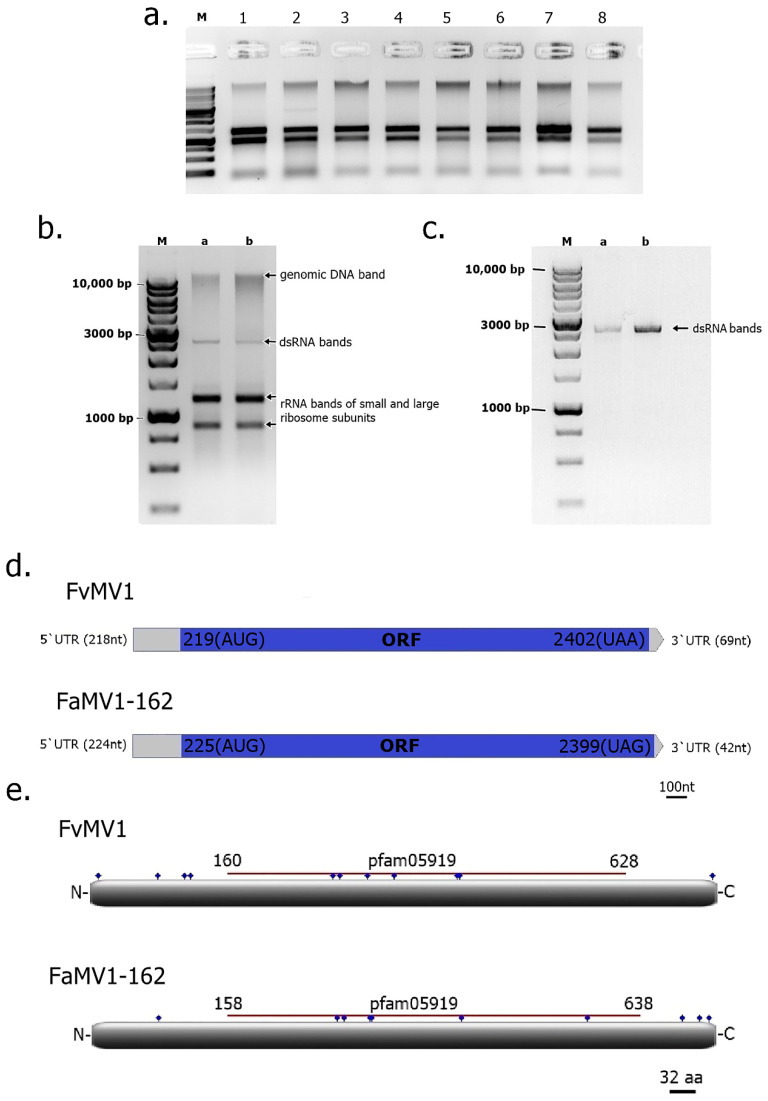
Figure 2.
Molecular characterization of Fusarium verticillioides mitovirus 1 (FvMV1) and Fusarium andiyazi mitovirus 1 strain 162 (FaMV1-62). (a) Representative Agarose gel electrophoresis (0.8% w/v in buffer TAE) of chromatography on cellulose extracts prepared from monosporic cultures of fungal strains for the identification of dsRNA mycoviruses. Lane M: DNA molecular weight marker (1Kbp, NZYDNA Ladder III, NZYTech® Paço do Lumiar, Lisboa, Portugal); lane 2: F. verticillioides isolate FvSec505; lanes 1 and 3 through 8: other Fusarium isolates from survey. (b) Agarose gel electrophoresis (0.8% w/v in buffer TAE) of chromatography on cellulose extracts from Fusarium andiyazi strain 162 (lane a) and Fusarium verticillioides strain Sec505 (lane b) showing dsRNA bands indicative of mycoviruses infection. (c) Agarose gel electrophoresis of the dsRNA bands identified in F. andiyazi strain 162 (lane a), and F. verticillioides strain Sec505 (lane b) after treatment with DNase and S1 Nuclease; as observed, both bands resisted digestion confirming their dsRNA nature. Lane M: DNA molecular weight marker (1Kbp, NZYDNA Ladder III, NZYTech®, Paço do Lumiar, Lisboa, Portugal). Gels were stained with ethidium bromide and nucleic acids visualized and photographed under UV light using a transilluminator (EC3 Imaging System—UVP, LLC). (d) Schematic representation of the genomes of FvMV1 and FaMV1-162. The blue rectangles represent the single ORF (5′ to 3′ sense) identified in each mycovirus. Start and Stop codons are noted in parentheses, and numbers represent their positions in the mycovirus sequenced genome. The grey rectangles represent the 5′- and 3′-untranslated regions (UTR) with their lengths indicated in parenthesis. Scale bar is drawn in nucleotide unit (nt). (e) Schematic representation of predicted RNA dependent RNA polymerase (RdRp) proteins encoded by FvMV1 and FaMV1-162. The gray box represents the full length predicted proteins from their amino-terminus (N-) to the carboxyl-terminus (-C). Blue dots indicate the positions of UGA-encoded tryptophan. The dark-red line drawn above the gray rectangles indicates the position (numbers indicate the aa position) of the conserved domain of the mitoviral RdRp Superfamily (pfam05919). Scale bar is drawn in amino acid unit (aa).

