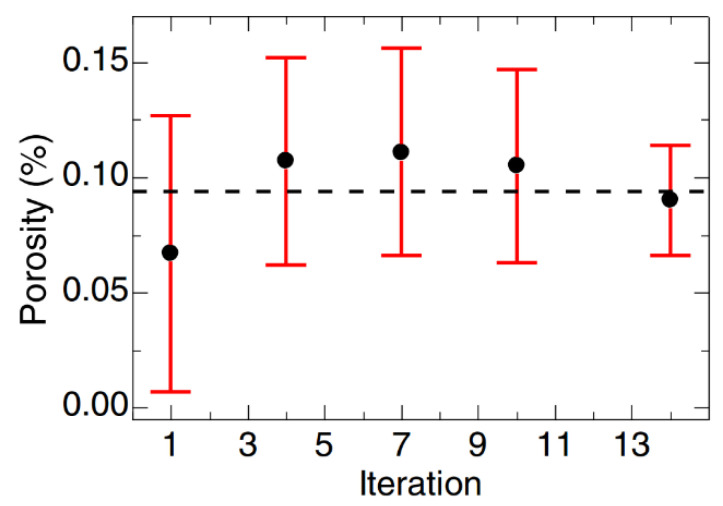
Figure 5.
Results from porosity measurements performed on 3D printed samples. Each point represents the average porosity (in percentage) found in six samples fabricated in five particular iterations. Red bars indicate standard deviation from this value. The dashed line represents the average porosity obtained from these five values [14]. Copyright 2014. Adapted with permission from Elsevier Science Ltd. under the license number 4803690436753 (Figure 5 [14]), dated 7 April 2020.

