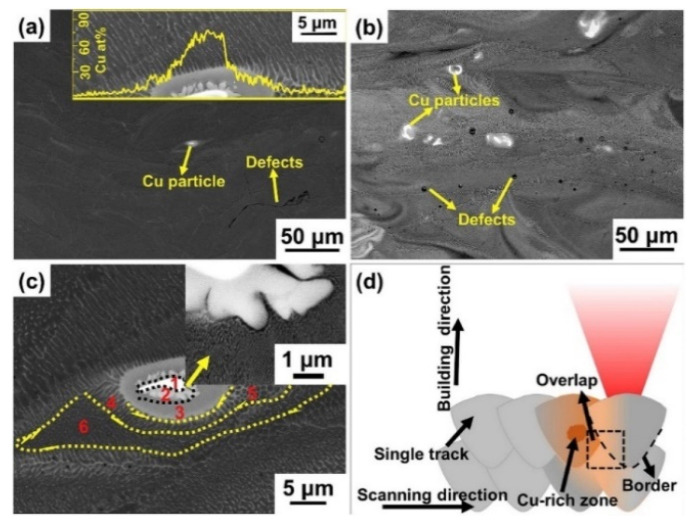
Figure 14.
BSE-SEM micrographs of SLM Al-xCu alloys: (a) 6Cu alloy (inset: Cu distribution across the Cu-rich zone); (b) 40Cu alloy; (c) Cu-rich zone in the 6Cu alloy (inset: high magnification). (d) Schematic illustrating the diffusion of Cu during SLM processing [115]. Copyright 2017. Adapted with permission from Elsevier Science Ltd. under the license number 4803700463746 (Figure 2 [115]), dated 7 April 2020.

