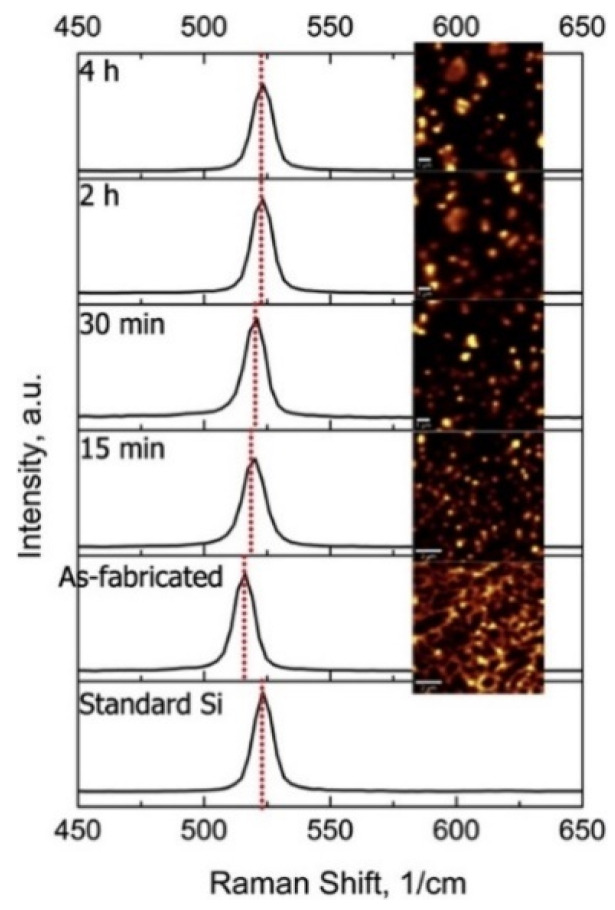
Figure 22.
Raman spectra for Si particles in Al-12Si alloys solution treated for different durations. The inset shows the Raman intensity mapping of the corresponding Al-12Si alloys measured in the region of 500–550 cm−1. The Raman spectrum for standard Si is also shown. A gradual decrease in the Raman shift during heat treatment can be observed [130]. Copyright 2015. Adapted with permission from Elsevier Science Ltd. under the license number 4803720364624 (Figure 8 [130]), dated 7 April 2020.

