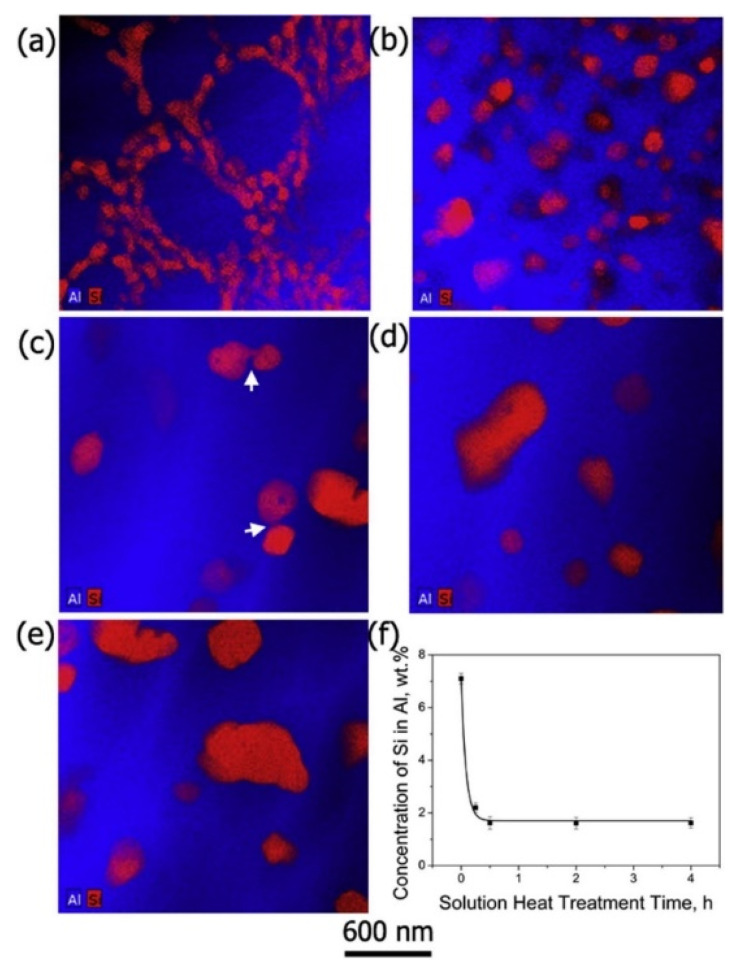
Figure 24.
STEM-EDX maps of the Al and Si distribution in the Al-12Si alloy in the (a) as-fabricated condition and after solution treatment at 773.15 K for (b) 15 min; (c) 30 min; (d) 2 h; and (e) 4 h; (f) Concentration of Si in Al for different solution heat treatment durations. The white arrows in (c) show the position of the joining neck between adjacent Si particles [130]. Copyright 2015. Adapted with permission from Elsevier Science Ltd. under the license number 4803721064179 (Figure 4 [130]), dated 7 April 2020.

