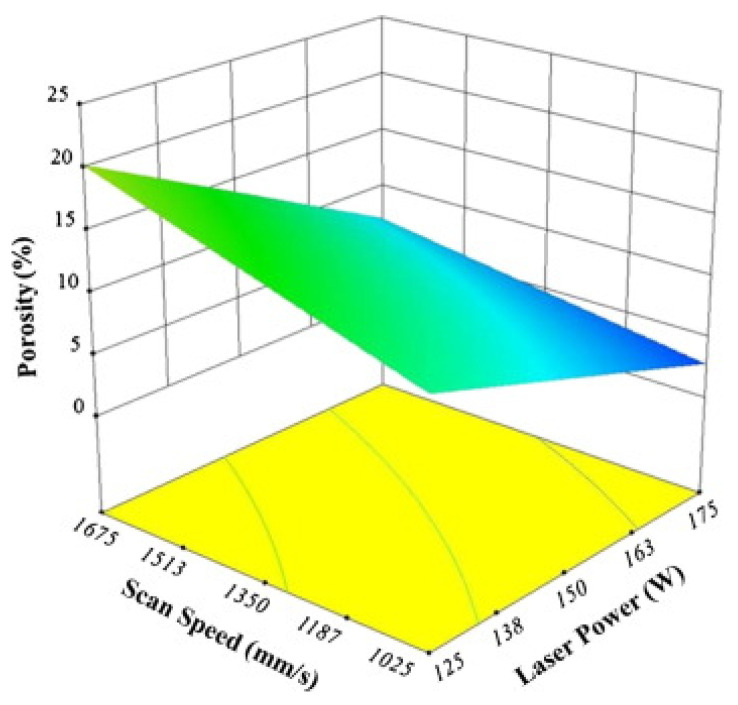
Figure 35.
Response surface plot showing the effect of the laser power and the laser scan speed on the porosity level at a constant hatch spacing (0.5 µm) and island size (5 mm) [166]. Copyright 2014. Adapted with permission from Elsevier Science Ltd. under the license number 4803731023945 (Figure 4 [166]), dated 7 April 2020.

