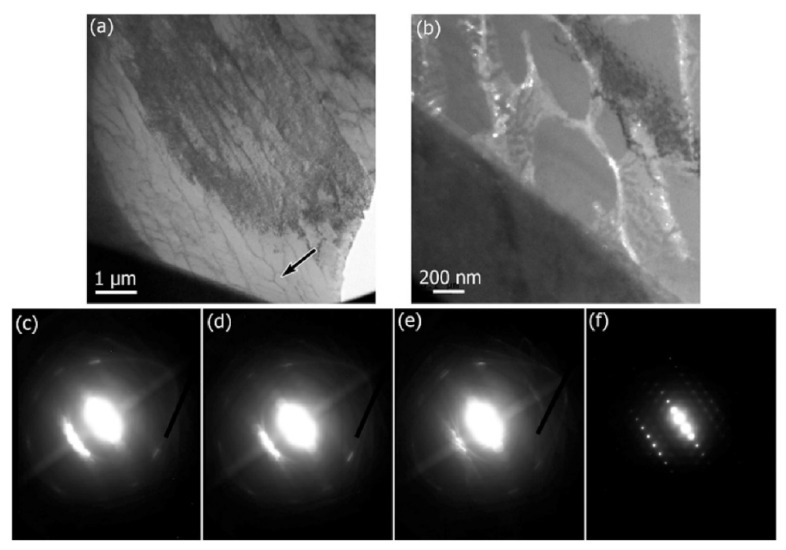
Figure 41.
TEM images of AlSi10Mg SLM samples along YZ plane taken using Al-reflection: (a) bright-field image and (b) dark-field image. The arrow in (a) indicates the region from which the dark field image (b) was obtained. The corresponding micro-diffraction patterns are shown in (c–f). The images in (c,d) correspond to the area of the cells on either side of the cell boundary and (e) is directly on the cell boundary. (f) Shows a diffraction pattern covering the two cells with the cell boundary [172]. Adapted with permission from Elsevier Science Ltd. under the license number 4803740596529 (Figure 2 [172]), dated 7 April 2020.

