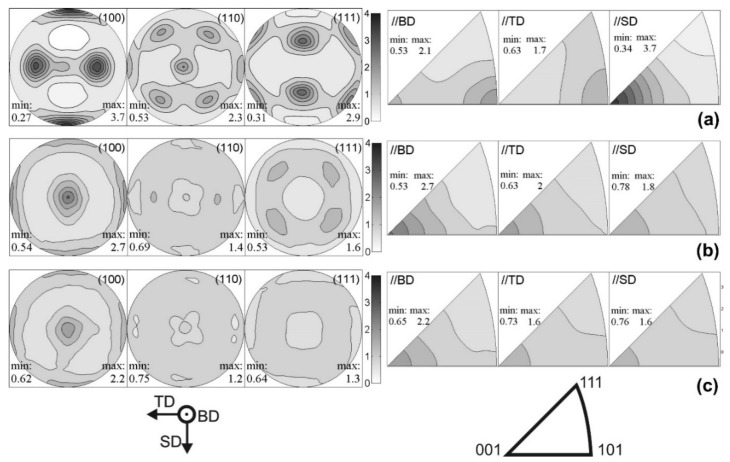
Figure 42.
AlSi10Mg SLM samples showing pole and inverse pole figures as a function of different scanning strategy. The building direction (BD) is correlated to the (1 0 0) pole figures and the scanning direction (SD) and the transverse direction (TD) are correlated to the (1 1 0) and (1 1 1) pole figure data. The figures correspond to: (a) unidirectional long scans, (b) bidirectional long scans with the vectors rotated to 90° and (c) an island scanning strategy without shift. The orientation of the coordinate system is displayed by the relative intensity of the diffraction peaks compared to the reference sample indicated in grey scale [71]. Copyright 2012. Adapted with permission from Elsevier Science Ltd. under the license number 4803740839232 (Figure 7 [71]), dated 7 April 2020.

