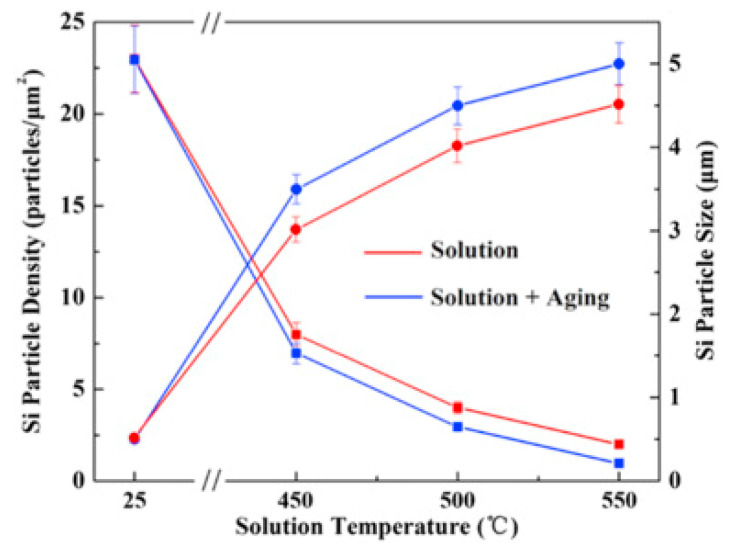
Figure 44.
Plot showing the Si particle density and size as a function of annealing treatment for AlSi10Mg SLM samples, calculated from scanning electron microscopy images [160]. Adapted with permission from Elsevier Science Ltd. under the license number 4803740322935 (Figure 5 [76]), dated 7 April 2020.

