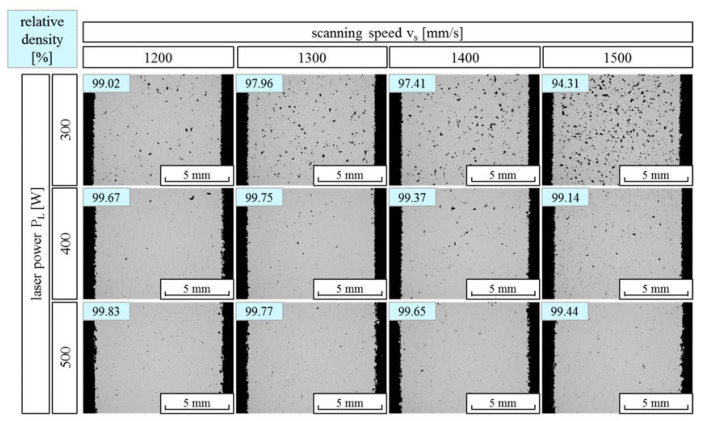
Figure 46.
Comparison of SEM images of polished SLM 7075 alloy specimens, presented along with relative densities (top left of the images) obtained for different combinations of laser power and scanning speed [182]. Copyright 2016. Adapted with permission from Elsevier Science Ltd. under the license number 4803741261901 (Figure 5 [182]), dated 7 April 2020.

