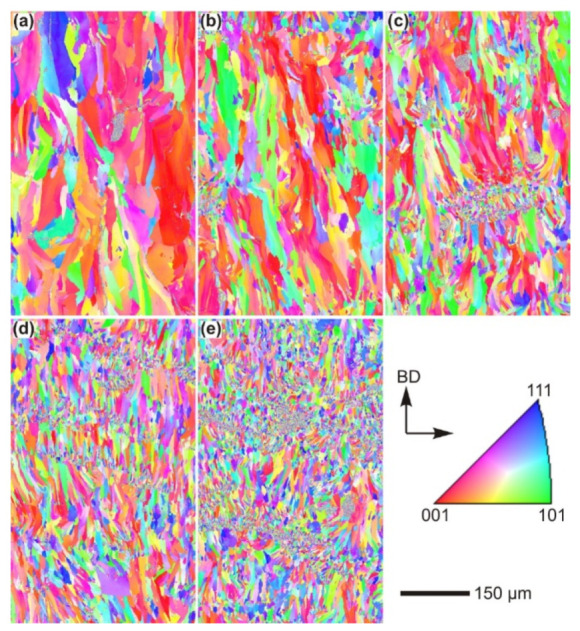
Figure 47.

EBSD orientation maps of samples with different concentrations of Si: 0 wt.% (a), 1 wt.% (b), 2 wt.% (c), 3 wt.% (d) and 4 wt.% (e). The observed plane is parallel to the building direction. The crystallographic orientation is represented by the inverse pole figure for aluminium [95]. Copyright 2016. Adapted with permission from Elsevier Science Ltd. under the license number 4803741466657 (Figure 5 [95]), dated 7 April 2020.
