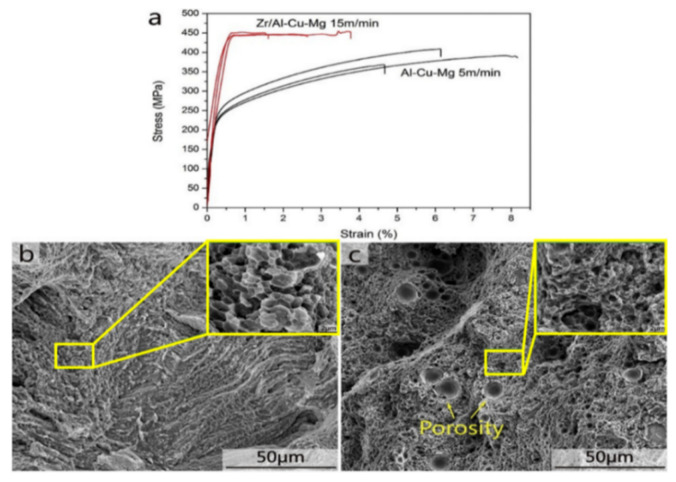
Figure 54.
(a) Stress-Strain curves of the Al-Cu-Mg and Zr/Al-Cu-Mg samples fabricated at different scanning speeds. SEM images showing typical morphologies of the fracture surfaces of the Al-Cu-Mg sample fabricated at a scanning speed of 5 m/min (b) and for a Zr/Al-Cu-Mg sample fabricated at a scanning speed of 15 m/min (c), respectively. The insets show magnified images of the areas enclosed in yellow squares [190]. Copyright 2017. Adapted with permission from Elsevier Science Ltd. under the license number 4595281038046 (Figure 4 [190]), dated 7 April 2020.

