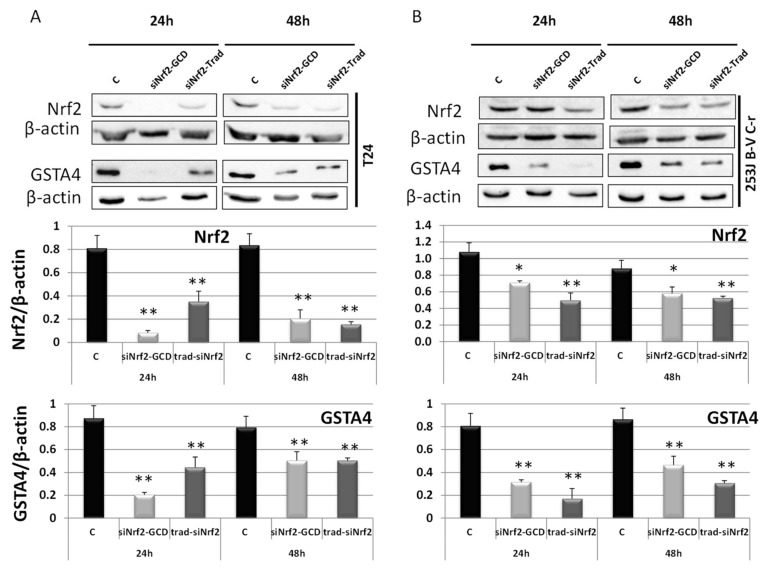
Figure 4.
Western blot analysis of Nrf2 and GSTA4 in T24 (A) and 253J B-V C-r (B) untreated (control, C) treated with siNrf2-GCD (0.08 µM siNrf2 in 8 µg/mL GCD) or transfected with the same amount of siNrf2 (0.08 µM) with a traditional protocol (siNrf2-Trad). Cells were collected after 24 h and 48 h from the treatments. Below, relative densitometric scanning of Nrf2 and GSTA4 expression normalized using the β-actin signal. Data are the mean ± SD from three independent experiments. ** p ≤ 0.01 and * p ≤ 0.05 vs. control.

