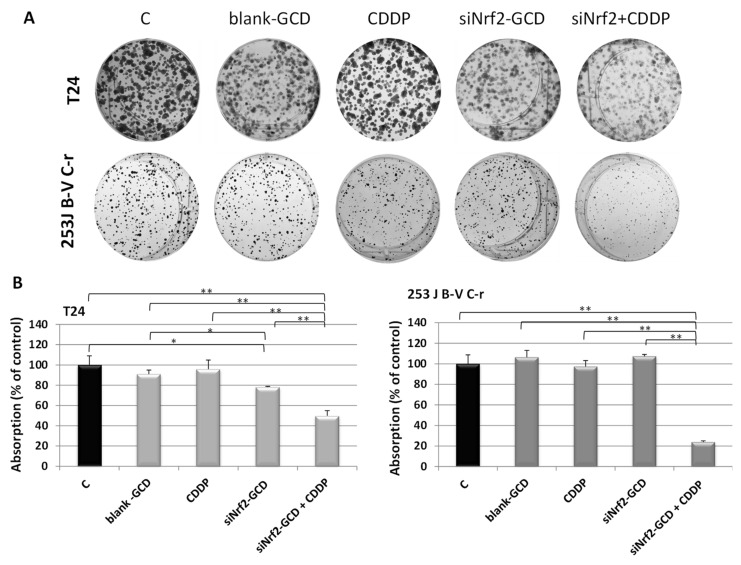
Figure 6.
Colony-forming assay. (A): Representative images of cell colonies stained with crystal violet performed in T24 and 253J B-V C-r cells treated with 4 µg/mL blank-GCD, 0.1 µg/mL CDDP, siNrf2-GCD (0.04 µM siNrf2 in 4 µg/mL GCD), and siNrf2-GCD in combination with CDDP. (B): Quantitative analysis of colonies. Data are the mean ± standard deviation of three measurements. * p < 0.05; ** p < 0.01.

