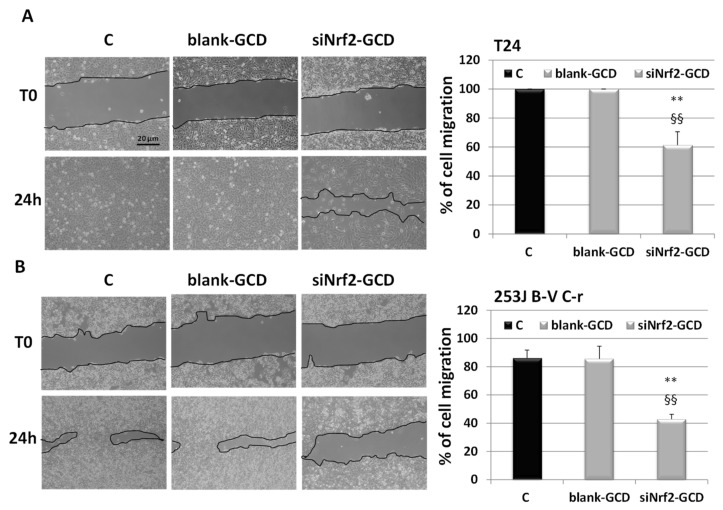
Figure 8.
Cell migration. Wound healing assay at 0 (T0) and at 24 h in T24 (A), 253J C-r cells (B) untreated (C) or treated with blank-GCD (4 µg/mL), or siNrf2-GCD (0.04 µM siNrf2 in 4 µg/mL GCD). On the right, the quantification of wound healing is shown. The endpoint of the assay was measured by calculating the reduction in the width of the wound after 24 h and comparing it to T0, which is set at 100%. The data are the mean ± SD of three independent experiments. ** p-value ≤ 0.01 vs. C. §§ p-value ≤ 0.01 vs. blank-GCD.

