Figure 3.
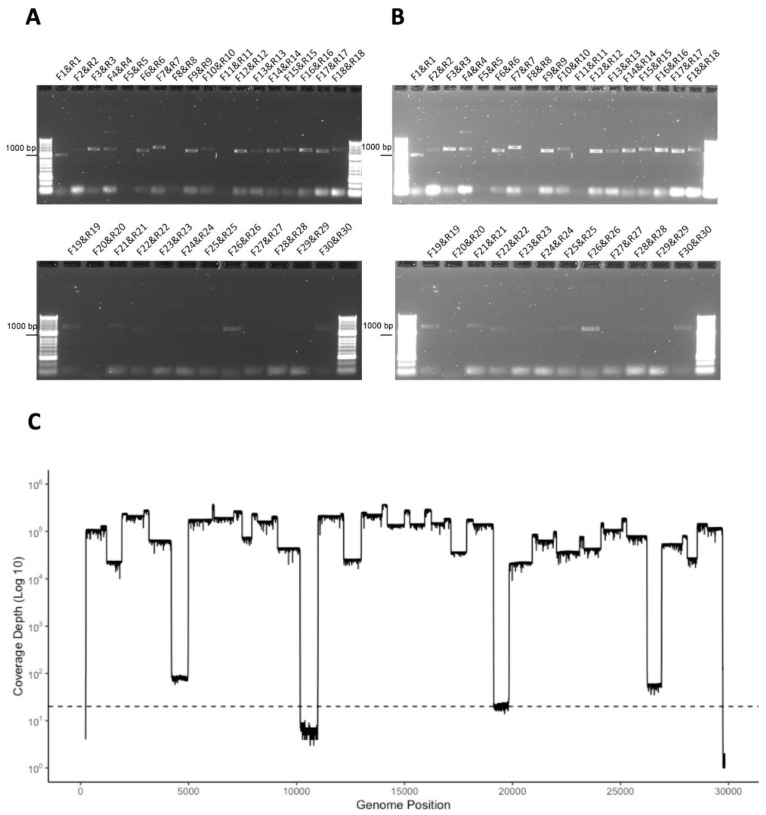
(A,B) Agarose gel electrophoresis analysis of amplicons generated by RT-PCR from RNA isolated from a nasopharyngeal swab taken from patient REMRQ0002, who had COVID-19, and diagnosed positive for SARS-CoV-2 by a laboratory-based test. Primer pairs are indicated above each amplicon. Note that the image in (B) is the same image as (A) but the brightness has been enhanced post-image capture in order to more clearly show amplicon products. (C) The amplicon products were purified and sequenced on a single flow cell using an Oxford Nanopore MinION. Shown are the number of reads that map (y-axis) to each amplicon across the SARS-CoV-2 genome from 5′ to 3′ (x-axis).

