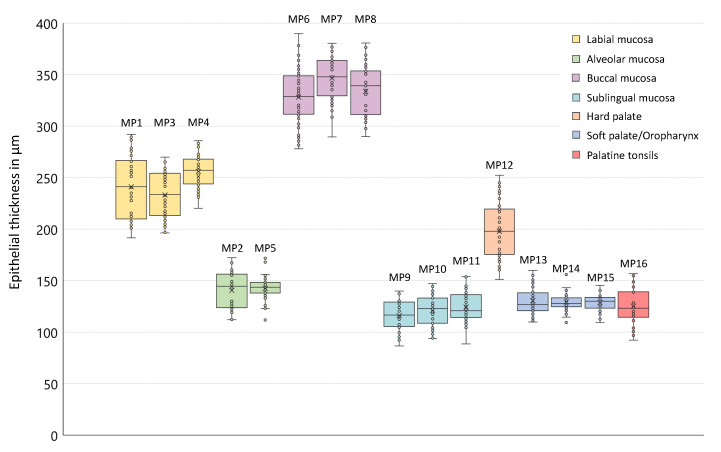
Figure 5.
Box plots of the epithelial thickness (age- and gender-independent). The results for all measurement points are presented by colored boxes in accordance with the corresponding investigation areas (cp. Figure 1). The sample median is depicted as central line inside the boxes, the sample mean value corresponds to the cross. The individual mean values are illustrated by circles. The width of the box is equivalent to the interquartile range. Maximum and minimum of the sample are shown by the whiskers.

