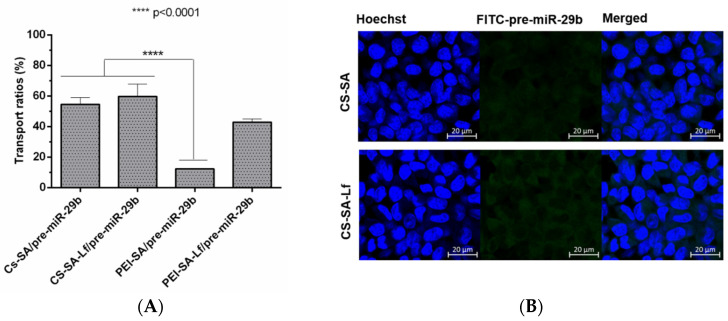
Figure 8.
The transport ratio of pre-miR-29b across the blood–brain barrier BBB during 4 h in RBE4 cells. (A) Intracellular cells after treating with CS-SA/pre-miR-29b-FITC (35 N/P ratio), CS-SA-Lf/pre-miR-29b-FITC (35 N/P ratio), PEI-SA/pre-miR-29b-FITC (15 N/P ratio), and PEI-SA-Lf/pre-miR-29b-FITC (15 N/P ratio). Quantification of fluorescence intensity for FITC was performed in the fluorimeter. Error bars represent standard deviations derived from three or more independent experiments performed in triplicate. ANOVA, mean ± SD. (B) Representative confocal microscopy images of RBE4 cells cultured in the transwells treated with CS-SA/pre-miR-29b-FITC and PEI-SA-LF/pre-miR-29b-FITC. The fluorescence signals were collected by LSCM with three channels: blue fluorescence from nuclei stained with 33342® (blue), green fluorescence from FITC labeled pre-miR-29b and the merged images of three channels. Scale bars 20 μm.

