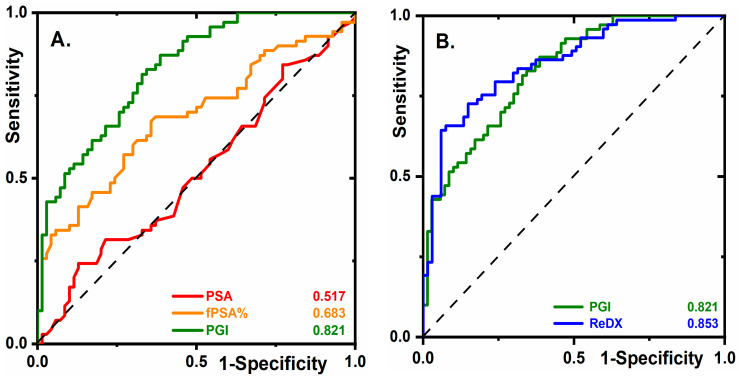
Figure 1.
Diagnostic prostate cancer (PCa) biomarkers. (A) Receiver operating characteristics (ROC) curves for PSA, fPSA%, and prostate glycan index (PGI) (see Line 17, Table S3) are shown using 140 serum samples (70 samples from non-cancer cohort and 70 samples from PCa cohort). (B) ROC curves for PGI and for the case of 3 samples (2 samples with high-grade prostatic intraepithelial neoplasia (HG PIN) and 1 with PCa) being moved from the non-cancer cohort into the PCa cohort (labeled as “ReDX”). For more details, see the text.

