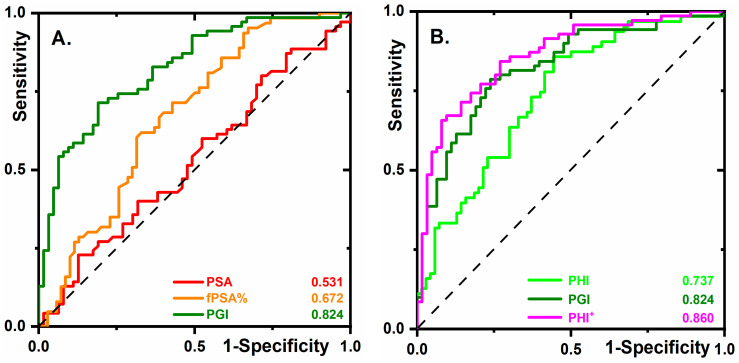
Figure 2.
(A) ROC curves for the same biomarkers as shown in Figure 1A but using the 133 samples in total (63 samples from the non-cancer cohort and 70 samples from the PCa cohort). (B) ROC curves for PHI, PGI, and PHI+ (PHI combined with PGI), obtained by analysis of the 133 samples.

