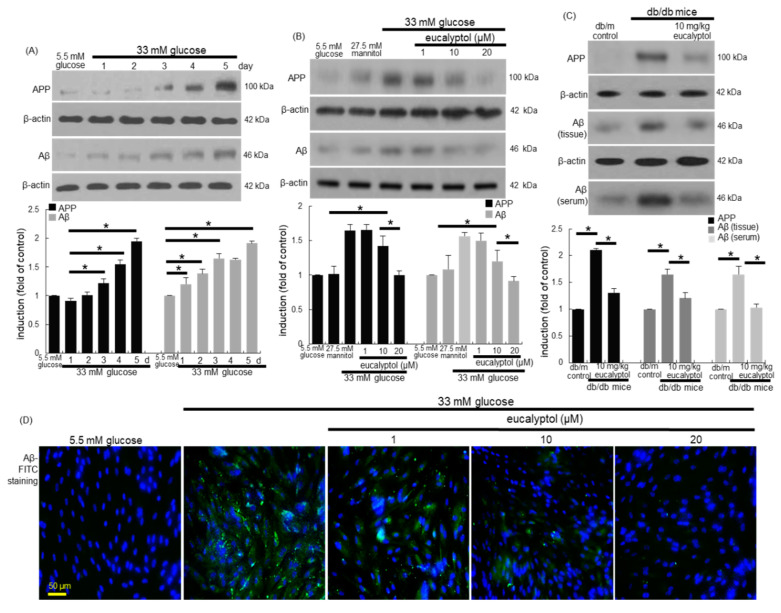
Figure 6.
Temporal induction of APP and Aβ (A) and the inhibitory effects of eucalyptol on their induction (B–D). RPE cell lysates, eye tissue extracts and sera were subject to western blot analysis with a primary antibody against APP, Aβ, and β-actin for an internal control. The bar graphs (mean ± SEM, n = 3) represent quantitative results of blot bands (A–C). * Values in respective bar graphs indicate a significant difference at p < 0.05. For the immunocytochemical analysis of Aβ, green FITC-conjugated secondary antibody was used for visualizing Aβ induction, being counterstained with 4′,6-diamidino-2-phenylindole for the nuclear staining (D). Each microphotograph (mean ± SEM, n = 3) was obtained by using a microscope system. Scale bar: 50 μm.

