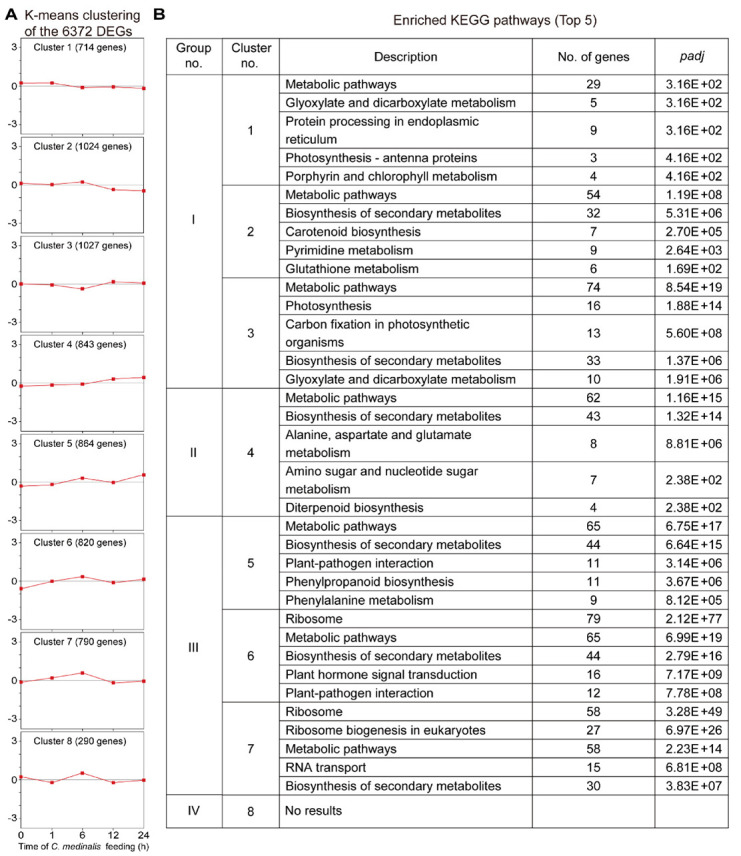
Figure 6.

Kyoto Encyclopedia of Genes and Genomes (KEGG) enrichment analysis of differentially expressed genes (DEGs) grouped by the K-means clustering method. (A) K-means clustering of differentially expressed genes scaled as Z-score. Eight clusters involving 6372 DEGs induced by C. medinalis feeding. The number of genes in each cluster is indicated. The expression data for individual genes are shown in light grey, and the average expression for each cluster is shown in red. The x-axis shows the different feeding stages and the y-axis shows the Z-scores. (B) KEGG enrichment analysis of genes in each cluster. The top five significantly enriched pathways are listed for each cluster. “No results” indicates that there were no significantly enriched KEGG terms.
