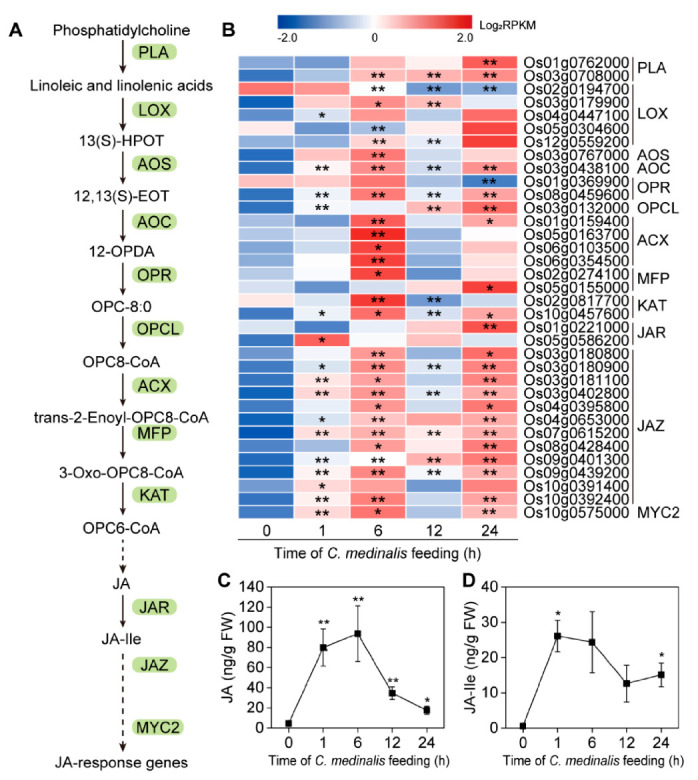
Figure 8.

C. medinalis-induced responses in the jasmonic acid (JA) pathway. (A) Overview of the JA pathway. (B) Heat map of the expression of genes associated with the JA pathway. Asterisks indicate a significant difference of the expression of genes at different time points relative to control (0 h): * padj < 0.05, ** padj < 0.01 via the Benjamini and Hochberg adjustment method. (C) JA and (D) JA-isoleucine conjugate (JA-Ile) contents (ng/g FW) in rice leaves. Values are mean ± SE of three biological replicates. Asterisks indicate statistically significant differences compared to time zero: * p values < 0.05, ** p-values < 0.01 (Student’s t test). phospholipase A1 (PLA); lipoxygenase (LOX); 13(S)-hydroperoxylinolenic acid (13(S)-HPOT); allene oxide synthase (AOS); 12,13(S)-epoxylinolenic acid 12,13(S)-EOT); allene oxide cyclase (AOC); 12-oxo-phytodienoic acid (12-OPDA); 12-oxophytodienoate reductase (OPR); 3-oxo-2-(2′(Z)-pentenyl)-cyclopentane-1-octanoic acid (OPC-8:0); OPC8-CoA ligase (OPCL); acyl-CoA oxidase (ACX); multifunctional protein (MFP); 3-ketoacyl-CoA thiolase (KAT); jasmonate resistant (JAR); jasmonate-ZIM domain (JAZ).
