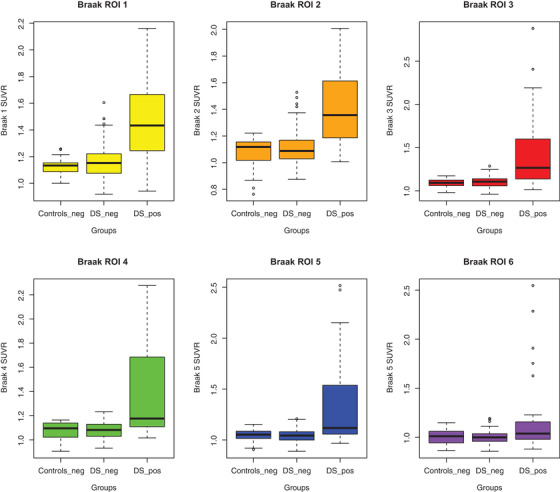
FIGURE 1.

Models for AV‐1451 with Global‐PiB SUVR. The plots are showing the linear and quadratic model fit lines for each Braak region (shown on y‐axes) and Global‐PiB SUVR (shown on x‐axes)

Models for AV‐1451 with Global‐PiB SUVR. The plots are showing the linear and quadratic model fit lines for each Braak region (shown on y‐axes) and Global‐PiB SUVR (shown on x‐axes)