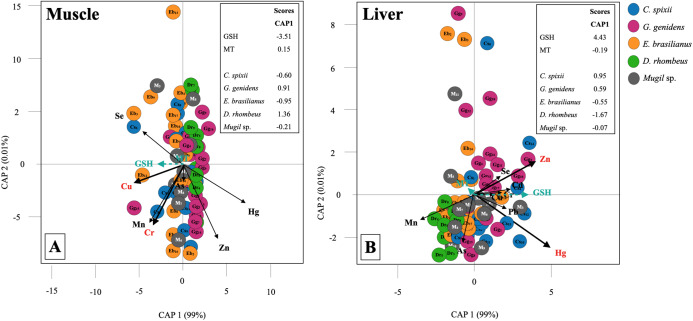
Figure 3. Canonical analysis of principal coordinates (CAP) indicating differences in expression of antioxidant biomarkers and the contribution of elemental contamination in estuarine fishes.
Vectors are based on Spearman correlation values > 0.5 (p < 0.05) for elements and scores for protein concentration and species (mean score among sampled). The proportions of data explained by axis 1 and 2 are in parentheses.

