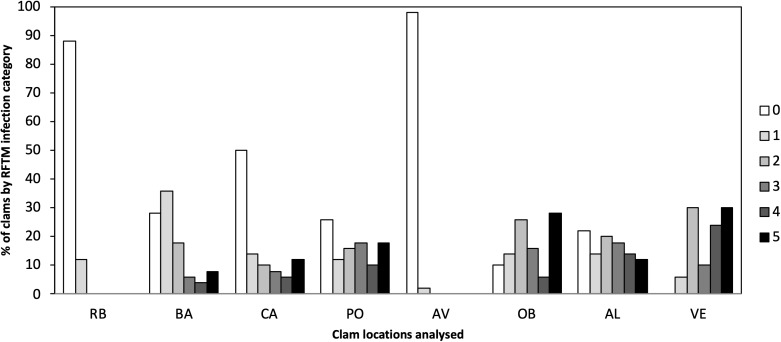
Figure 2. Percentage of P. olseni infection level of the different analyzed clams localities by RFTM method.
RB, Ribadeo; BA, Barallobre; PO, Ría de Pontevedra; CA, Cangas; AV, Aveiro; OB, Óbidos; AL, Algarve (Gulf of Cádiz); VE, Venice Lagoon. Right legend represents P. olseni infection intensity scored using 0–5 Mackin’s infection intensity scale (Ray, 1954).

