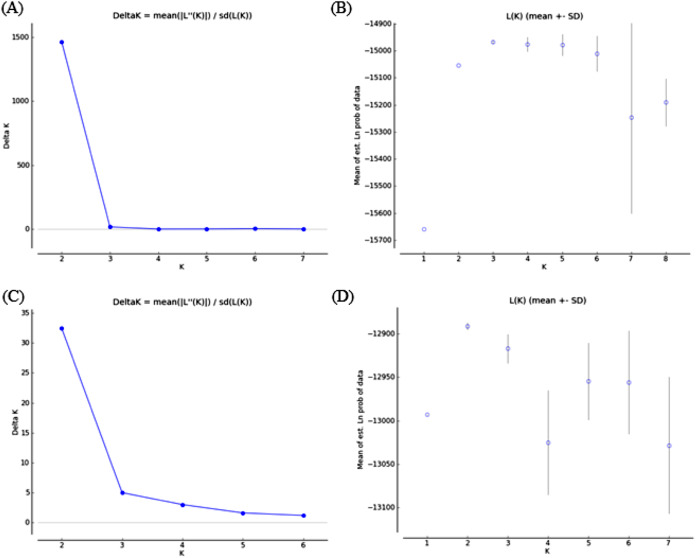
Figure 4. Bayesian analysis of genetic structure from microsatellite data with (A and B) and without VE individuals (C and D).
For each data set, ΔK as a function of K (A and C) and distribution of estimated log likelihood of K, L(K), (B and D) are shown. For L(K) each point corresponds to the mean L(K) ± SD across 10 independent runs.

