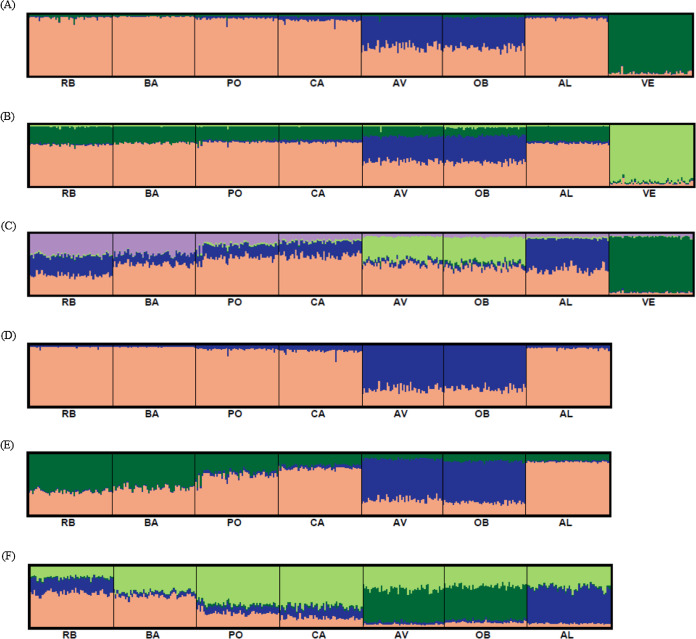
Figure 5. Graphic representation of the estimated membership coefficients for each individual obtained from the Bayesian clustering analysis of genetic structure for K = 3–5 including all samples (A–C) and for K = 2–4 excluding VE individuals (D–F).
Colours correspond to genetic clusters. Each individual is represented as a vertical bar, partitioned into K colored components that represent the individual’s estimated membership coefficients in the K clusters. There is no color correspondence across figures based on different data sets. Sample names are abbreviated as in Table 1.

