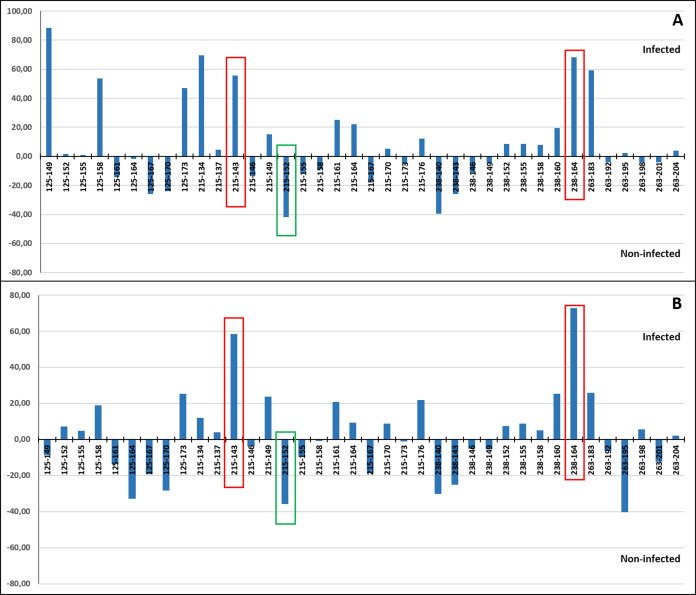
Figure 7. Correspondence values for the frequency of alleles at the microsatellite loci and infection/non-infection. Analysis carried out including (A) and excluding (B) VE individuals.
With red and green rectangles are highlighted the alleles that might indicate higher and lower propensity for P. olseni infection, respectively.

