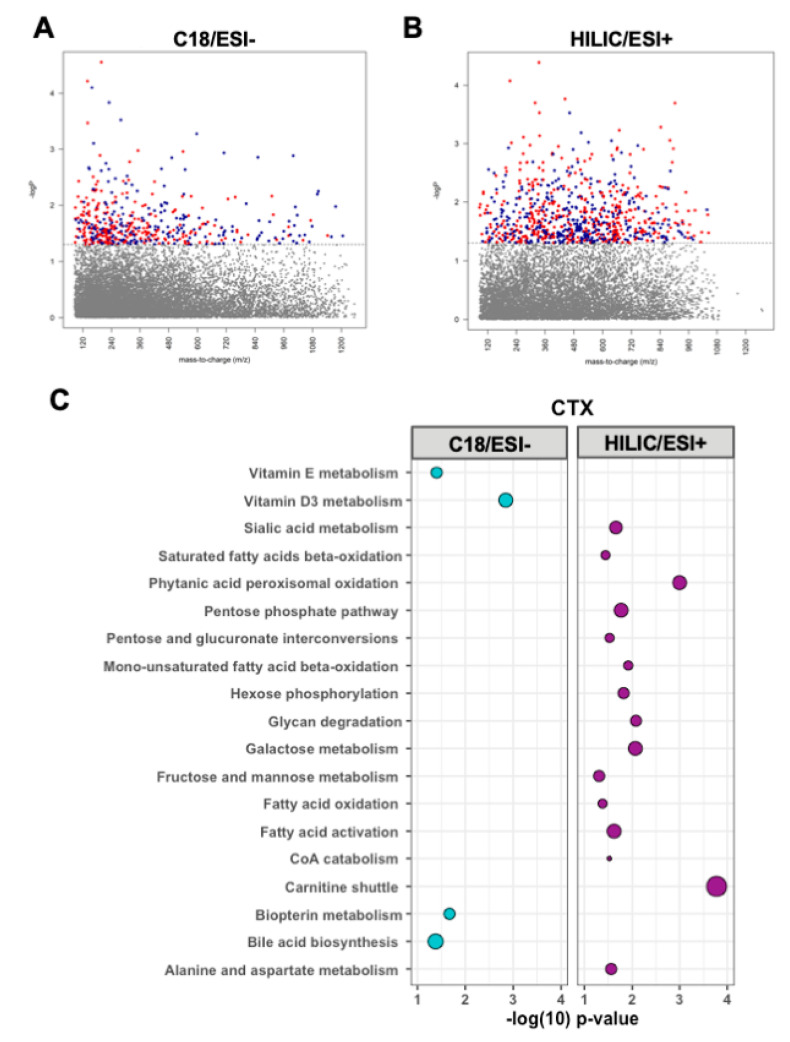
Figure 3.
Manhattan plots depicting metabolic features by their mass-to-charge ratio (m/z) significantly associated with (red = inverse relationship, blue = positive relationship) C-terminal telopeptides of type I collagen (CTX) using (A) C18/ESI and (B) HILIC/ESI+ high-resolution metabolomics data. (C) Pathway analyses of the 790 metabolic features from C18 and 469 metabolic features from HILIC+ significantly associated (p < 0.05) with CTX. Larger bubbles indicate a greater number of significantly enriched metabolites within the respective pathway. Blue represents C18/ESI- data, purple represents HILIC/ESI+ data.

