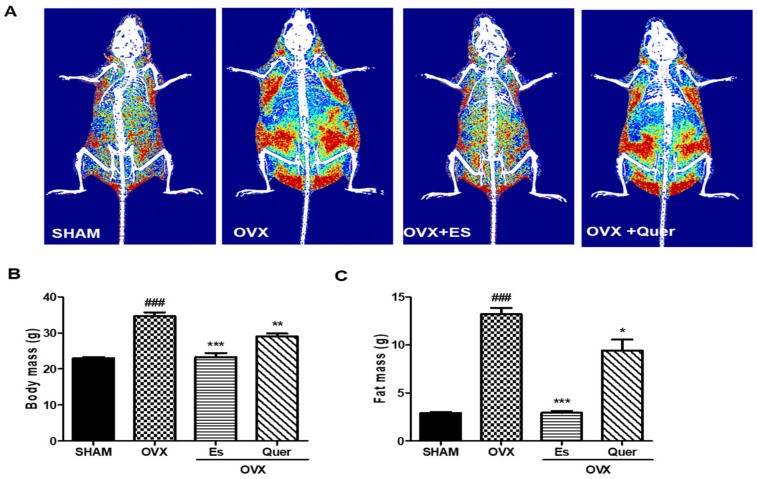
Figure 1.
Effect of quercitrin on the distribution of fat mass and body mass in OVX mice. (A) The radiograph of body fat is represented by dual energy X-ray absorptiometry (DXA) images of mice. Red indicates high-density fat, yellow indicates intermediate-density fat, and blue indicates low-density fat; (B) Body mass; (C) Fat mass. All values are expressed as mean ± SEM values. ### p < 0.001 vs. control group. * p < 0.05, ** p < 0.01, and *** p < 0.001 vs. OVX group (N = 10 per group).

